In all the history of UK energy supply, there has probably never been a more pressing time to understand how the energy we use is generated, traded and supplied – as well as the influence Russia has on our energy market.
With all eyes on the terrible situation unfolding in Ukraine – and the impact that’s having on oil and gas prices around the world – it’s perhaps understandable to look for any signs that could potentially counter rocketing energy costs.
Before the conflict started, there was some hope that the strong winds the UK’s been experiencing lately could have had a positive impact on energy prices.
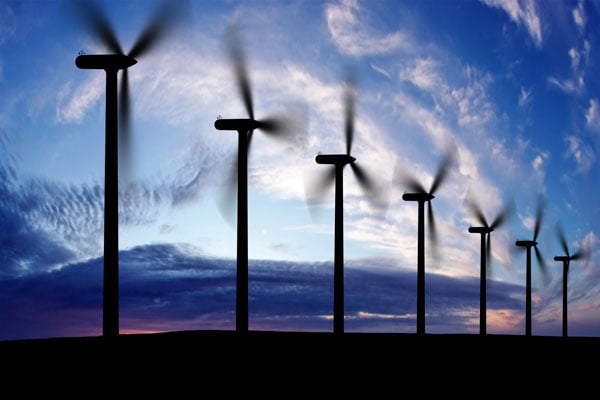
But while storms Dudley, Eunice and Franklin have meant that wind power has been contributing a far larger share of our generation mix than normal – hitting 45% and more at times, compared to our yearly average of 24.6%* – the truth is, this hasn’t created any significant long-term reductions in energy costs.
Why?
The reason is that despite an increasing share of renewable energy, the UK – like much of Europe and many other nations – is still very much dependent on gas. And with gas being such a key energy commodity, power costs tend to track the gas market, regardless of how that power has been generated.
I appreciate that’s not good news for energy consumers.
We look at the topic of energy costs in more detail in our ‘Understanding the UK Energy Market’ reports, which focus on energy commodity prices.
The first of these reports tracks how the UK’s energy mix has changed and diversified. It also considers the key question so many consumers ask: despite the growth in renewables, why are energy prices so high?
You can download your free copy here.
Our second report will then look in more detail at the various political, geographical and environmental drivers that influence how the energy markets behave.
This includes what’s behind the high prices we’ve been experiencing since last September, and why this trend is likely to continue for some time to come, especially as the Russia/Ukraine conflict unfolds. Once you’ve downloaded the first report, we’ll send you our second report on Thursday 10 March.
Then in the coming months, we’ll be looking in detail at other key aspects of energy costs – including the growing share of non-commodity charges that can contribute as much as 60% of the final invoiced amount.
We hope our reports enhance your understanding of a complex but vital commodity for every business, and strengthen your ability to make more informed decisions about buying and managing energy.
*National Grid: Live Status (grid.iamkate.com), as of 1:00pm on 21 February 2022.

.png)
/npm214%20Digital_H_UB136.jpg)
/npm214%20Digital_H_UB101.jpg)
/npm214%20Digital_H_UB132.jpg)
/npm214%20Digital_H_UB121.jpg)

/npm214%20Digital_H_UB134.jpg)


/Author%20Profile%20Waterhouse_Lee_G.png)
