Skip to content
English
  • There are no suggestions because the search field is empty.

How to create and update graph information

The graph tool enables you to quickly configure and overlay any meter within the system and produce a customised chart view. 

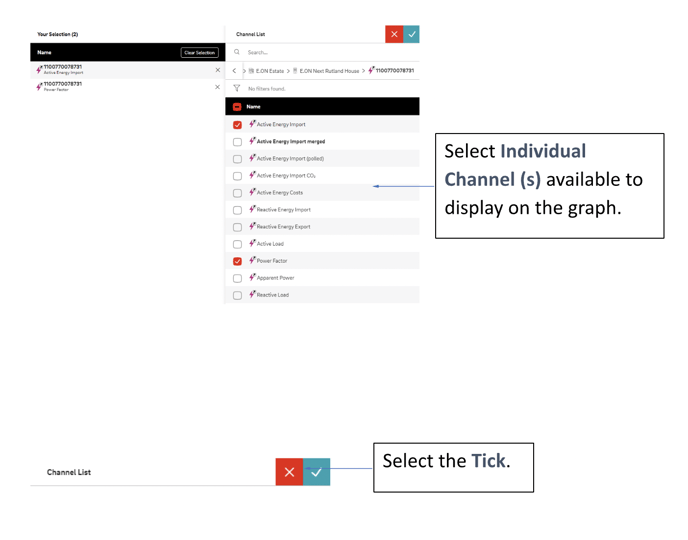
This tool allows you to view electricity data of multiple units of measure in one chart, for example; Consumption (kWh), Power Factor, and Carbon Emissions (kgCO2). You can add or remove different units of measure that provide you with a bespoke graph.


Create and Edit Graph Information 

image1

Screenshot 2024-04-04 at 16.25.55

Screenshot 2024-04-04 at 16.25.44


Screenshot 2024-04-04 at 16.27.46


Screenshot 2024-04-04 at 16.28.30