How to create and update graph information
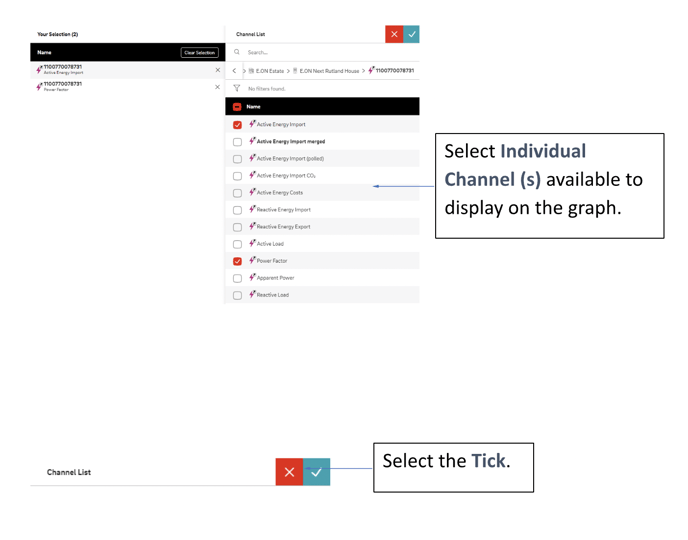
The graph tool enables you to quickly configure and overlay any meter within the system and produce a customised chart view.
This tool allows you to view electricity data of multiple units of measure in one chart, for example; Consumption (kWh), Power Factor, and Carbon Emissions (kgCO2). You can add or remove different units of measure that provide you with a bespoke graph.
Create and Edit Graph Information


